Here we develop a transportation sector model for India with several
sub-sectors or branches:
* road transport
- light duty vehicles (LDV)
- medium duty vehicles (MDV) - heavy duty vehicles (HDV)
- buses
+ city
+ inter-city
* rail transport
* electric city transport
- trams and trolleys
- metro and short-distance trains
* air transport
- domestic and international
* water transport
- domestic
- international
All transportation services deliver two types of services: passenger transportation, and freight.
Light Duty Vehicles (LDV)
LDV or cars are modeled to deliver two types of transportation
services, based on efficiency/fuel consumption per trip:
* highway passengerkm (P-LDV-HWY)
city passenger*km (P-LDV-CTY)
Commodities
GSL <- newCommodity(
  name = "GSL",
  unit = "PJ",
  timeframe = "ANNUAL")
Transport services
PLDVHWY <- newCommodity(
  name = "PLDVHWY",
  desc = "LDV passengers transportation on highway",
  unit = "MPKm", # "million passenger * km",
  timeframe = "YDAY")

PLDVCTY <- newCommodity(
  name = "PLDVCTY",
  desc = "LDV passengers transportation in city",
  unit = "MPKm", # "million passenger * km",
  timeframe = "YDAY")
Infrastructure
GSTATION <- newCommodity(
  name = "GSTATION",
  desc = "Gas station",
  unit = "PJ", # number of cars to fuel a year
  timeframe = "ANNUAL")

CHARGEST <- newCommodity(
  name = "CHARGEST",
  desc = "Electric car charing station",
  unit = "GWh", # number of cars to fuel a year
  timeframe = "ANNUAL")
Gasoline cars
# Technologies
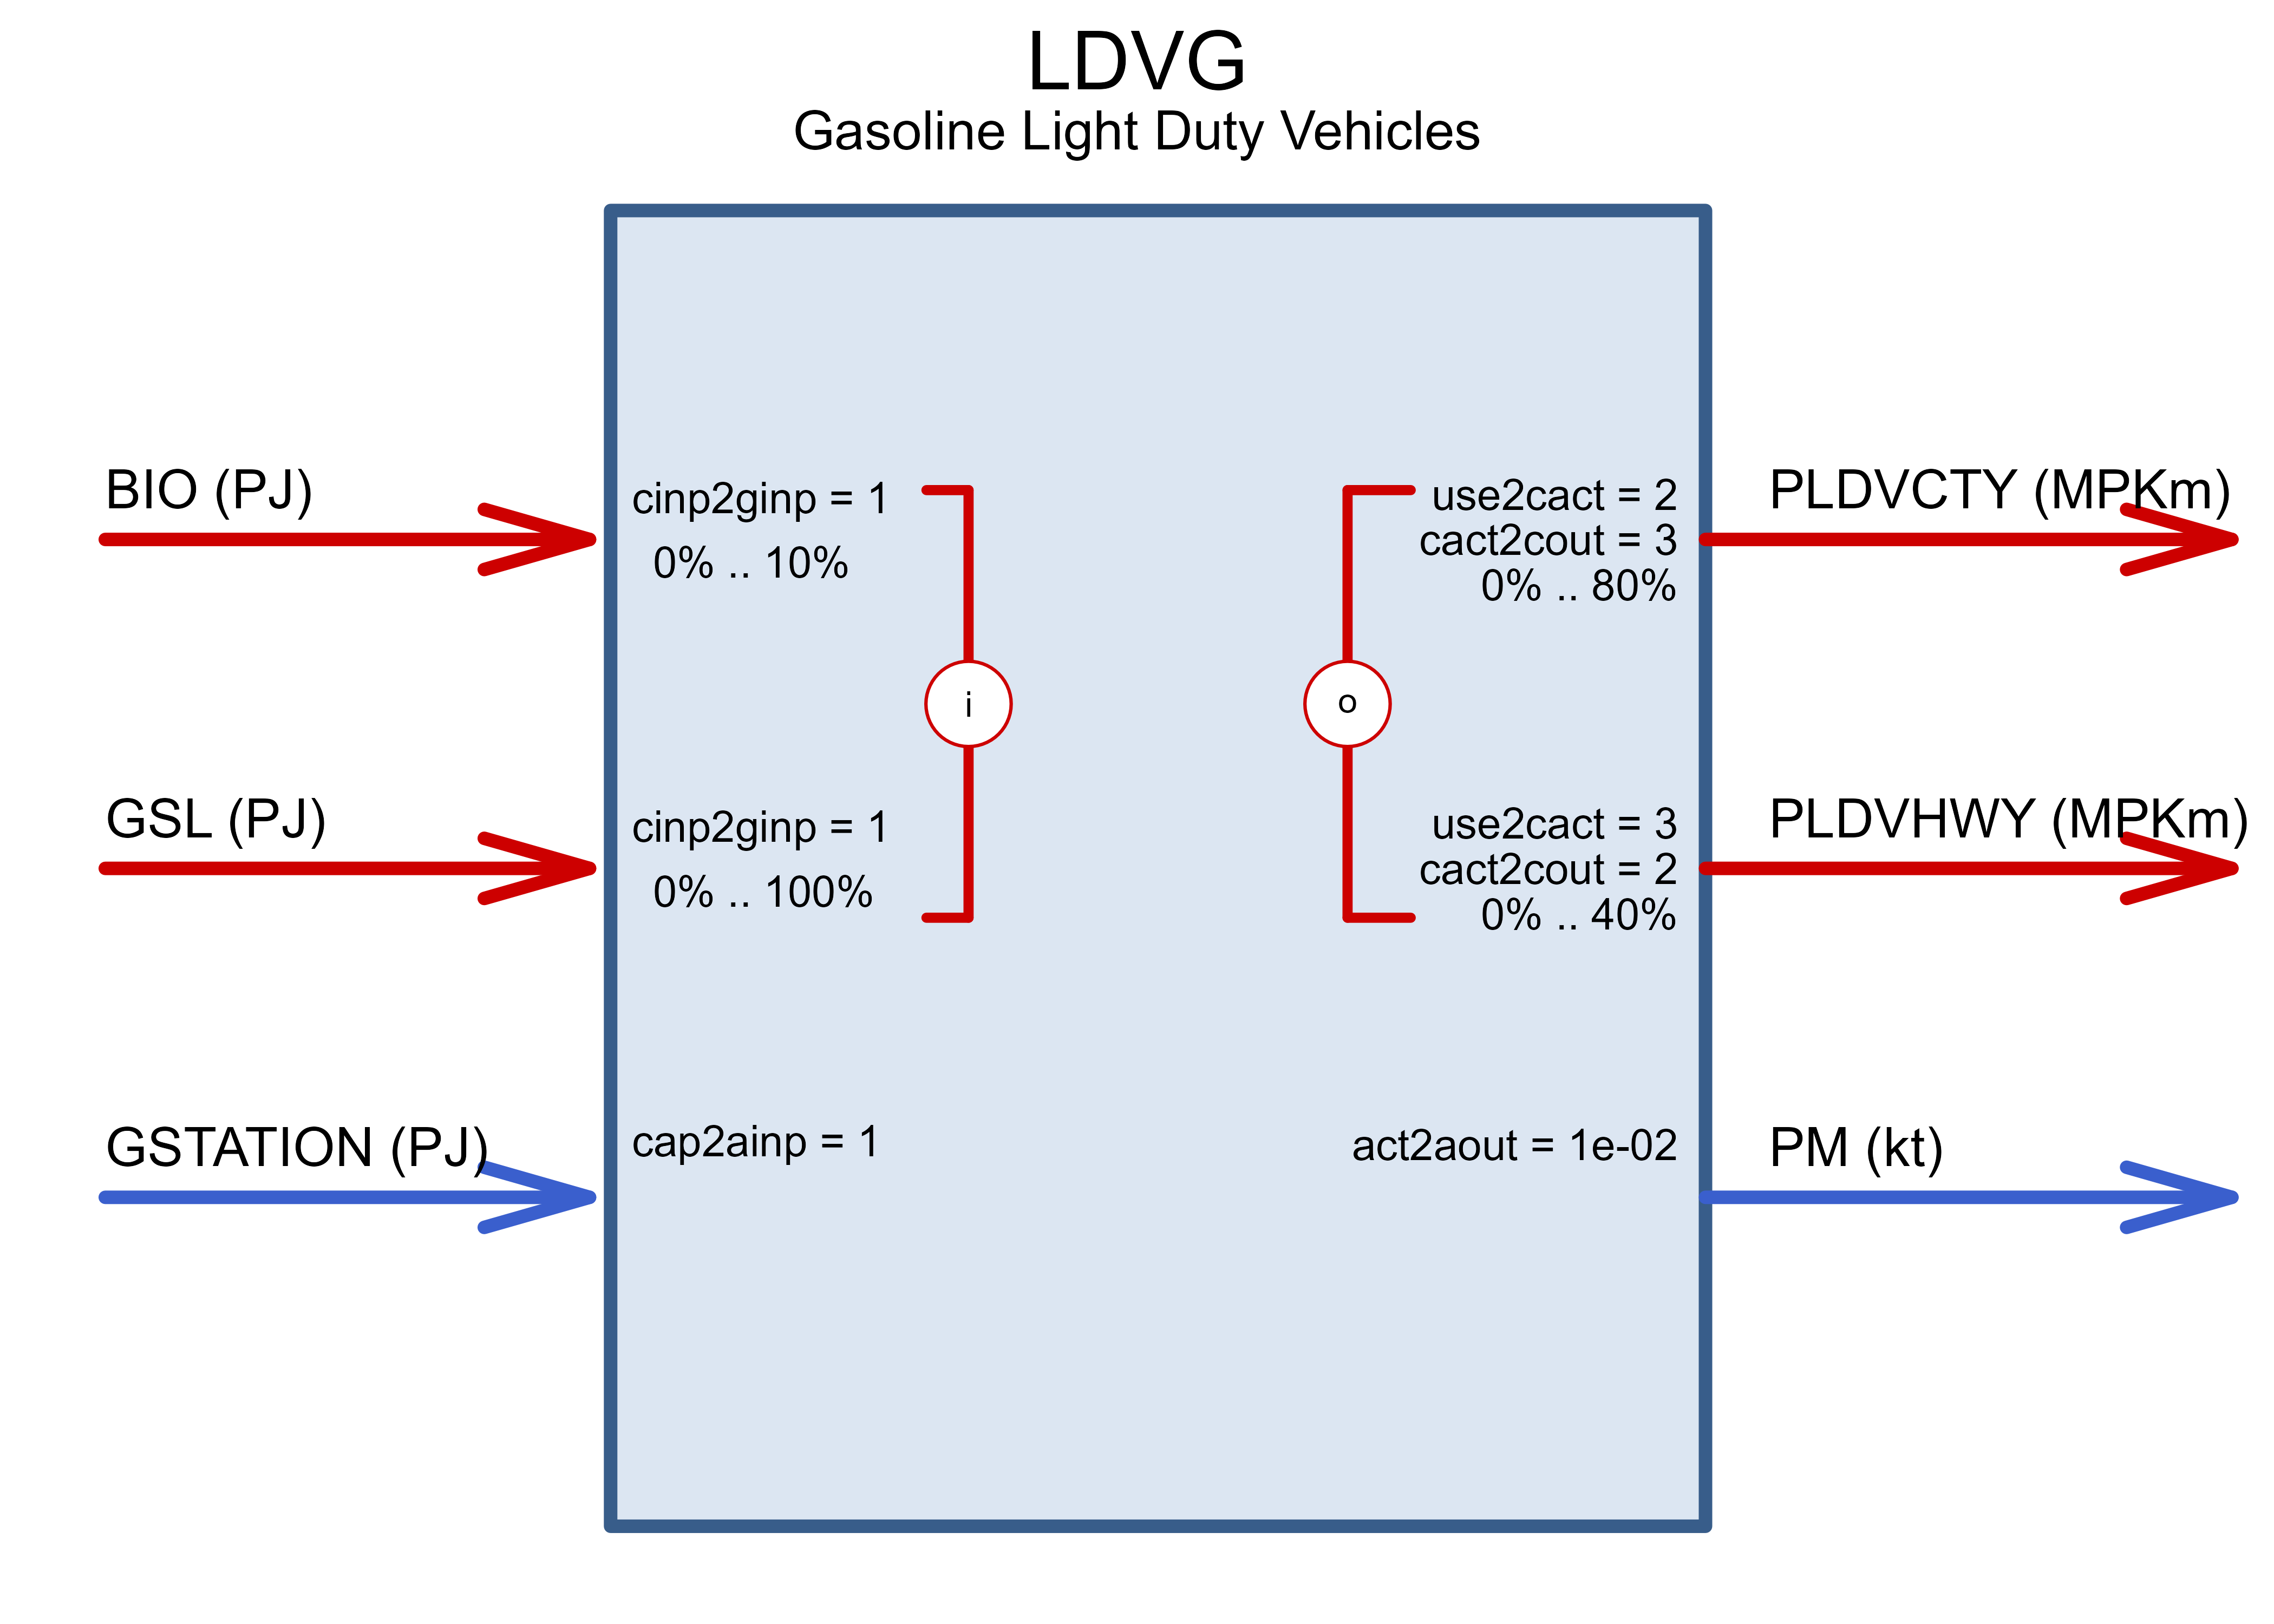
LDVG <- newTechnology(
name = "LDVG",
desc = "Gasoline Light Duty Vehicles",
input = data.frame(
comm = c("GSL", "BIO"),
unit = "PJ", # for simplicity and electrification scenarios, normally "PJ"
group = "i"
),
output = data.frame(
comm = c("PLDVHWY", # passenger * km, highway
"PLDVCTY"), # passenger * km, city
unit = "MPKm", # million passenger * km
group = "o" # a number or string, "o" = output
),
units = list(
capacity = "1000 Vehicles",
activity = "million km, city", # measured in one of the output commodities
costs = "MUSD"
),
cap2act = 10, # 10000 km per car a year => 10000 * 1000 / 1e6
ceff = data.frame(
comm = c("GSL", "BIO", "PLDVHWY", "PLDVCTY"),
use2cact = c(NA, NA, 3, 2), # !!! calculate million km per unit of input
share.up = c(NA, .1, .4, .8),
cact2cout = c(NA, NA, 2, 3) # passengers per vehicles (assumption)
),
olife = list(olife = 10),
capacity = list(
region = NA,
year = 2022,
stock = 500
),
invcost = list(
invcost = 15 # 15000 [USD/car] * 1000 [cars] / 1e6 => MUSD/1000 cars
),
fixom = list(
fixom = .5 # repairs a year, taxes and fees, tires, oil change, parking etc.
),
# varom = list(
# varom = ... # could be "tires, oil change"
# )
aux = list(
acomm = c("GSTATION", "PM"),
unit = c("PJ", "kt")
), # N cars fueled a year
aeff = list(
acomm = c("GSTATION", "PM"),
cap2ainp = c(1, NA), # estimate number of trips to gas-station a year
act2aout = c(NA, .01) # find emissions data per km
)
)
draw(LDVG)